Newer TS-7600 Product Available. The TS-7600 or TS-7700 are the new and improved versions of the TS-7500 series! Recommended for new designs.
Blistery cold weather is starting to sink in, which ought to ignite an instinctual desire to get your house in order and monitor it so the water pipes don’t freeze and burst. So, we’ll take a timely look at a project setting up some temperature probes in various areas, reading them, and reporting in a custom dashboard. A true home automation expert would take things further by setting up relays to turn on heat tape or even maybe some actuators to control water flow. Maybe next year, but for now, we just want to be able to monitor important areas of our home (in this case a cabin in Montana) and understand temperature patterns over time for better planning. As with most projects, there is more than one solution, especially if it depends on what you have on hand. At the time, the list of things in hand were as follows: Home
Newer TS-7600 Product Available. The TS-7600 or TS-7700 are the new and improved versions of the TS-7500 series! Recommended for new designs.
- 4x Temperature sensors (Thermocouples)
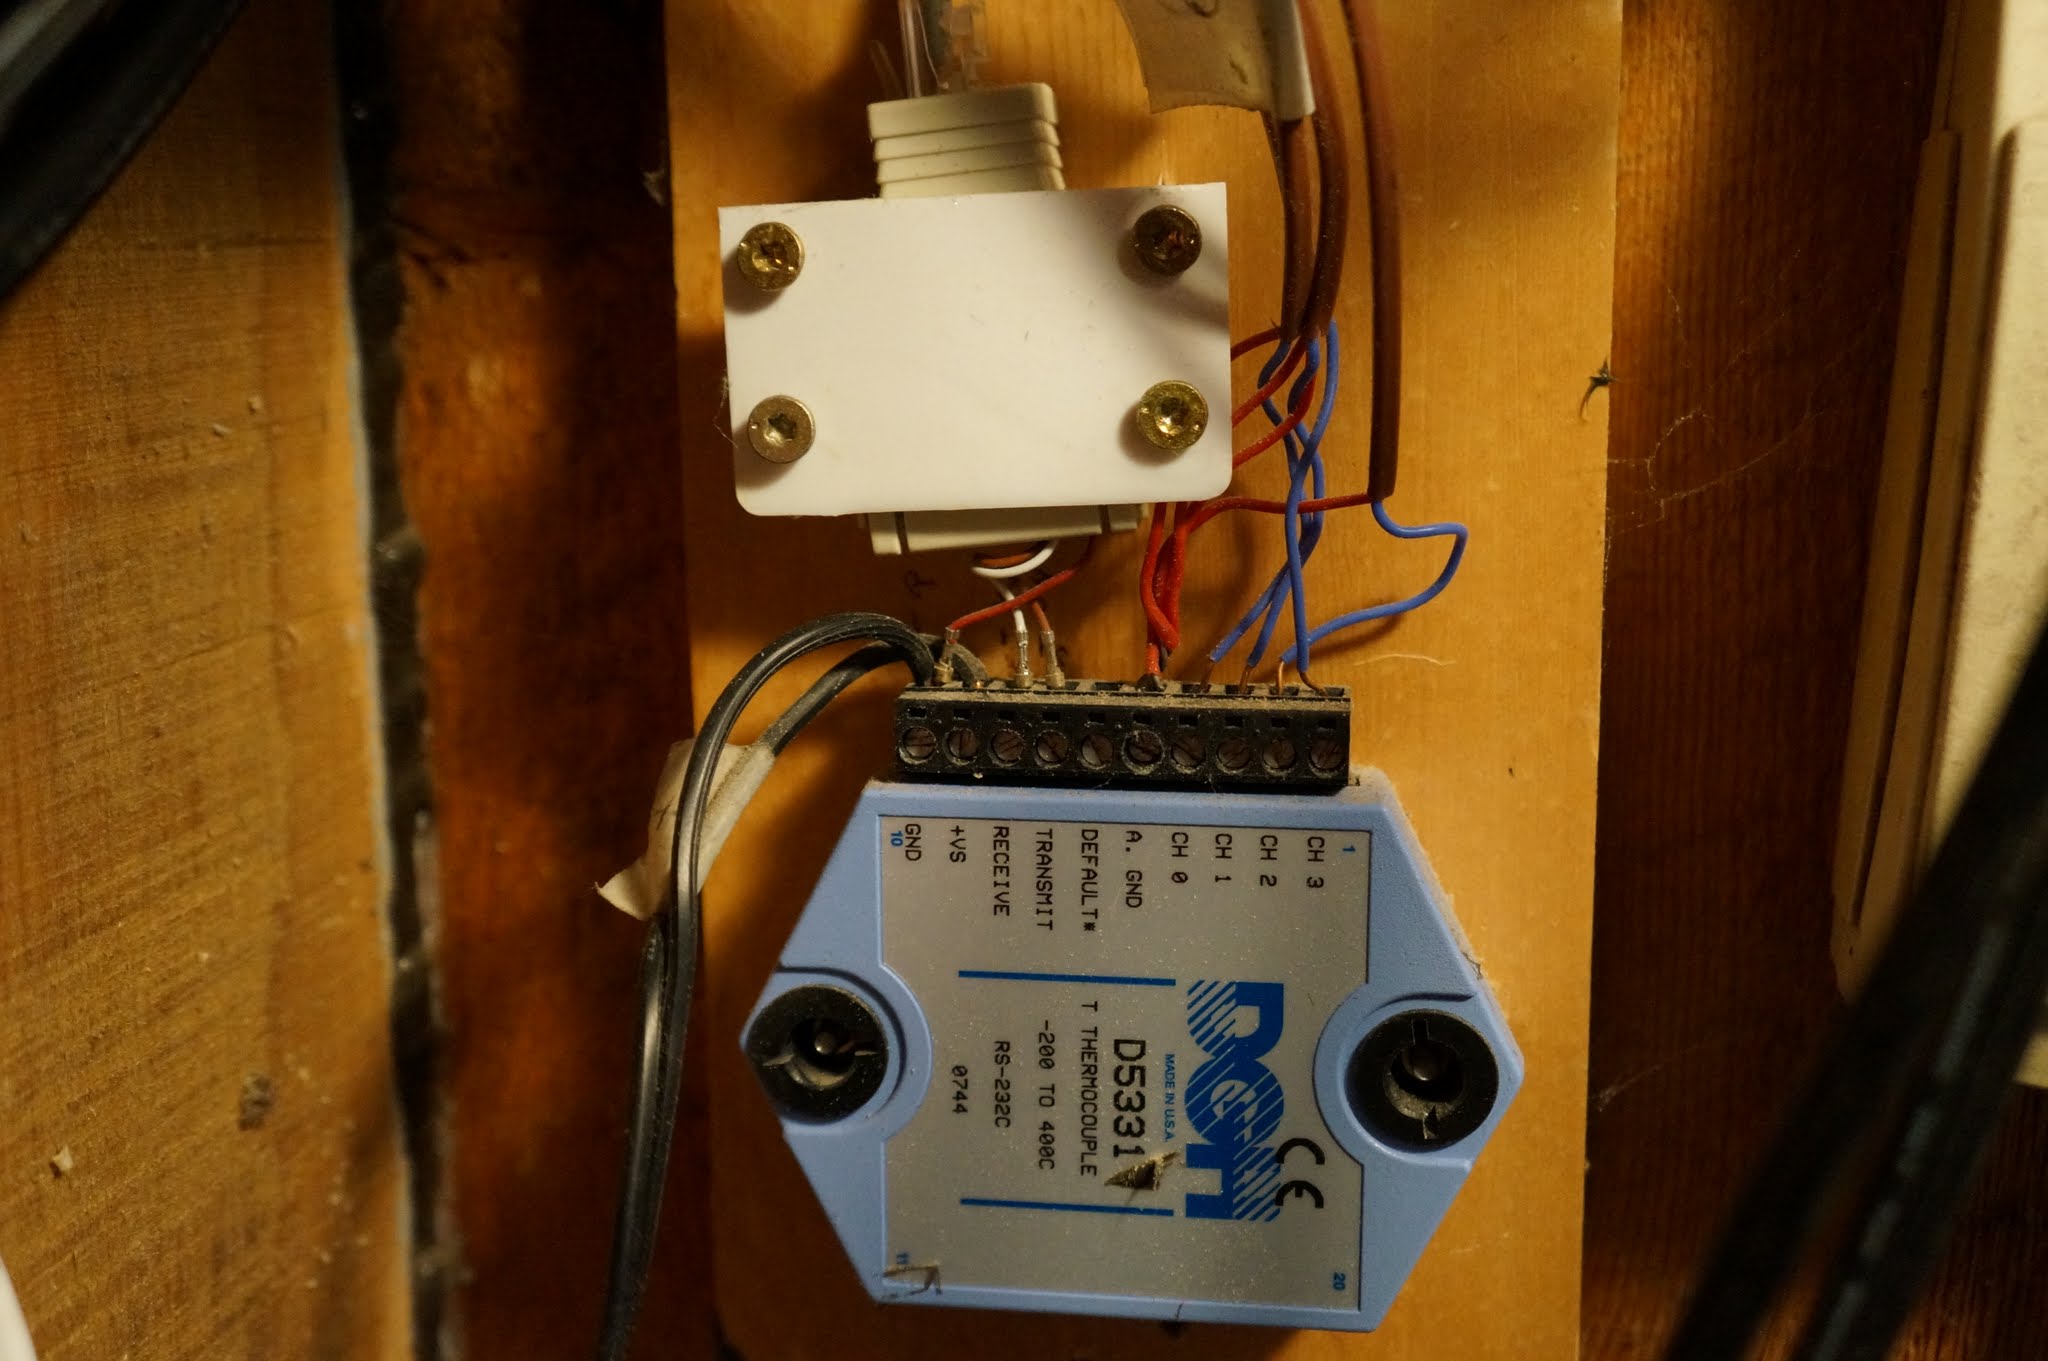
- 1x RS-232 Thermocouple Module, specifically the DGH D5331
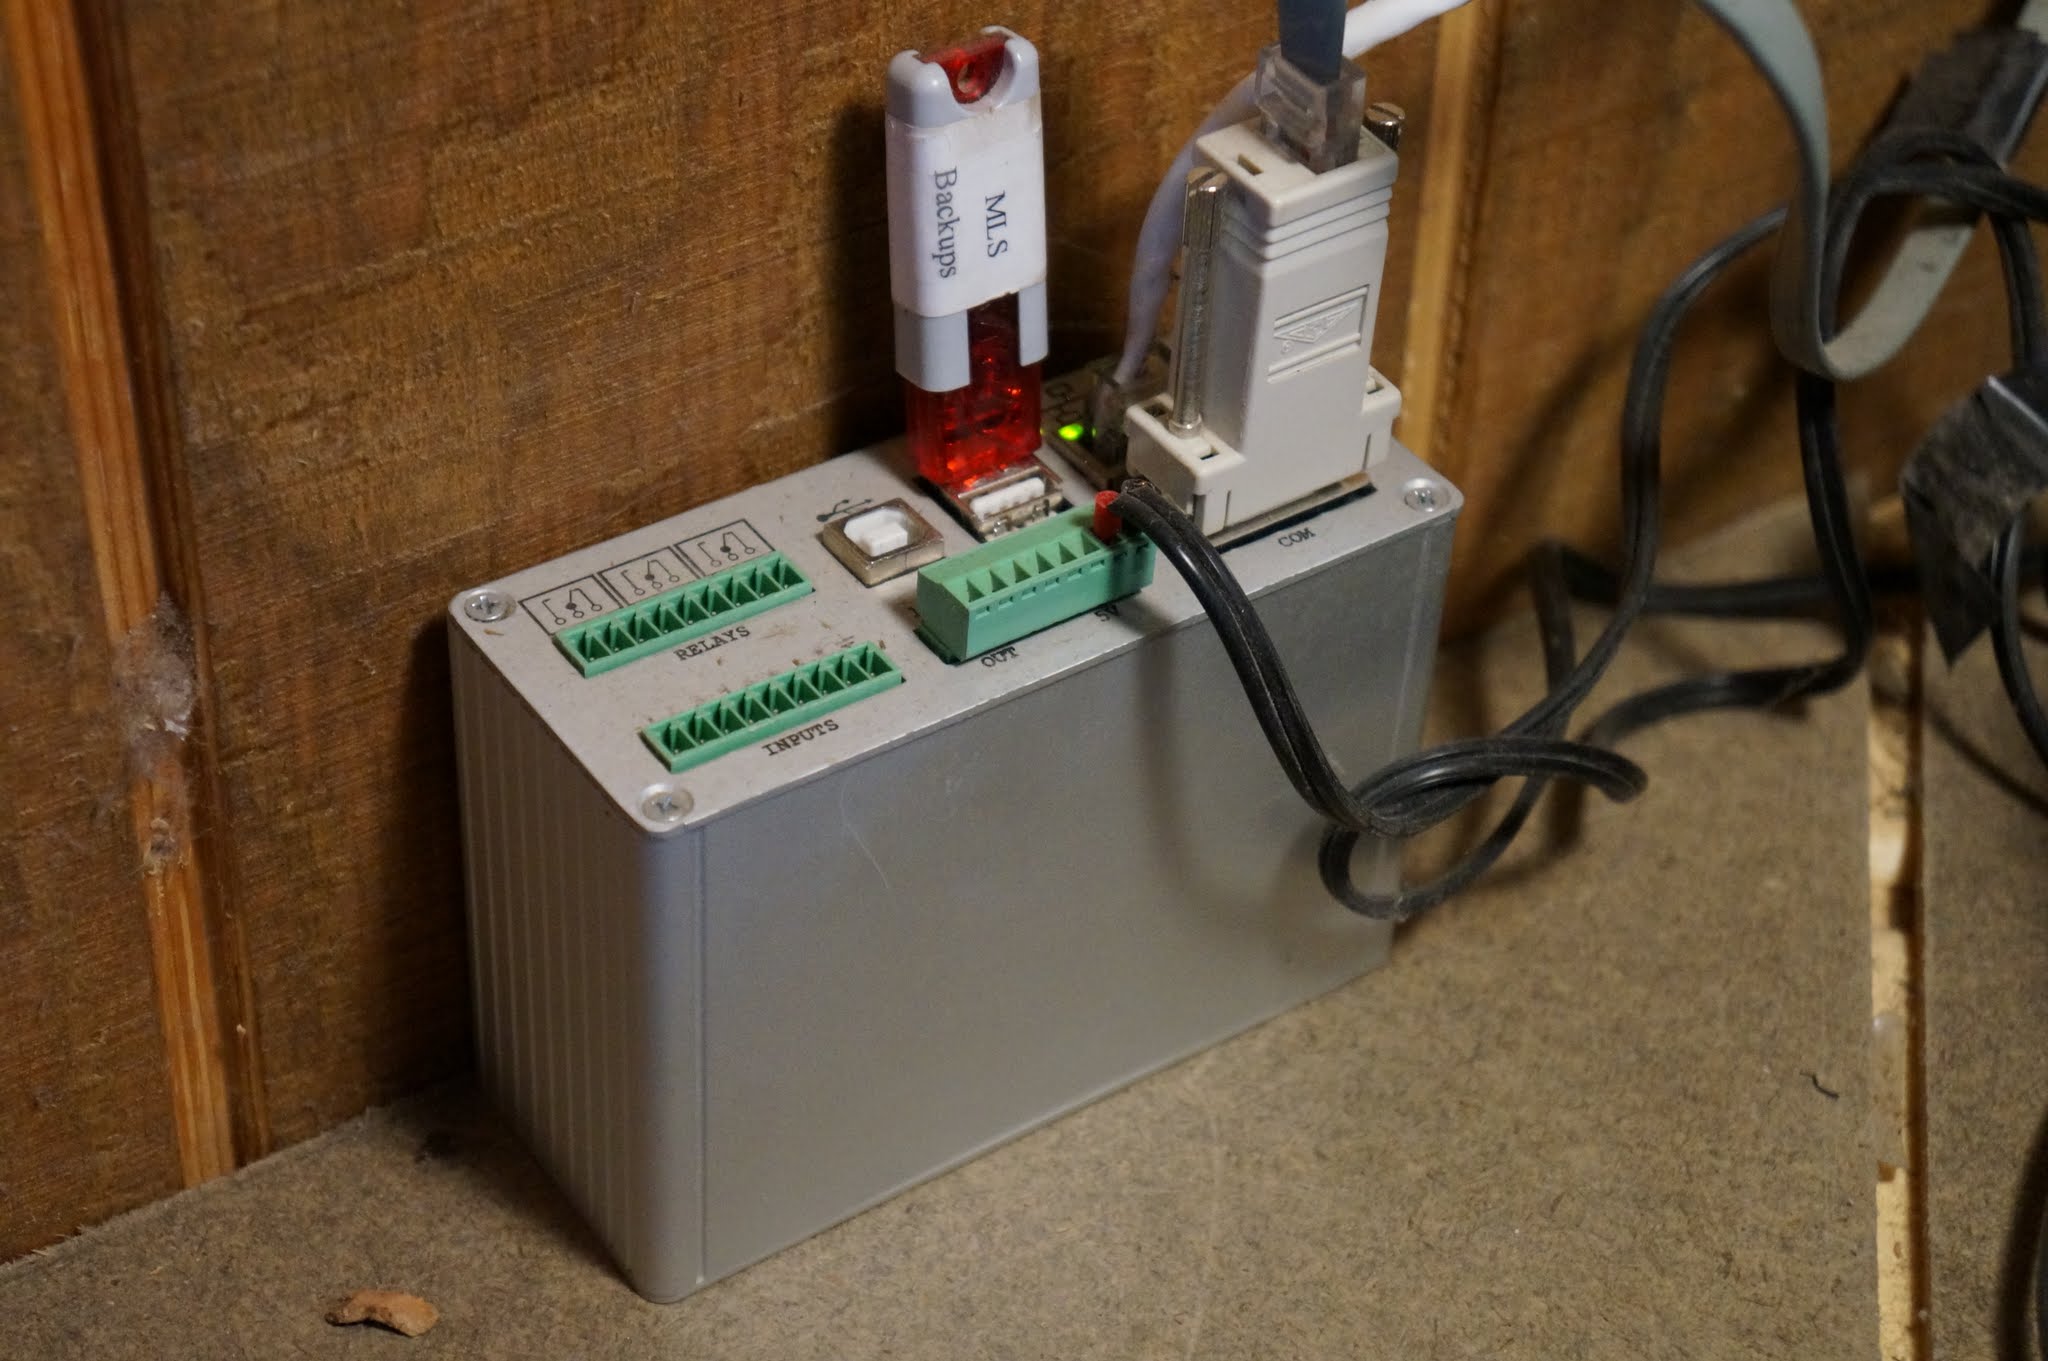
- 1x TS-7500 Single Board Computer with TS-752 and Enclosure
- 1x USB Thumb Drive for storage
- Various wiring, including Ethernet
- 1x DB9 Male to RJ45 Female Adapter
- 1x Web server (desktop, virtual machine, or cloud based)
Overall, this is what we’re looking to build:
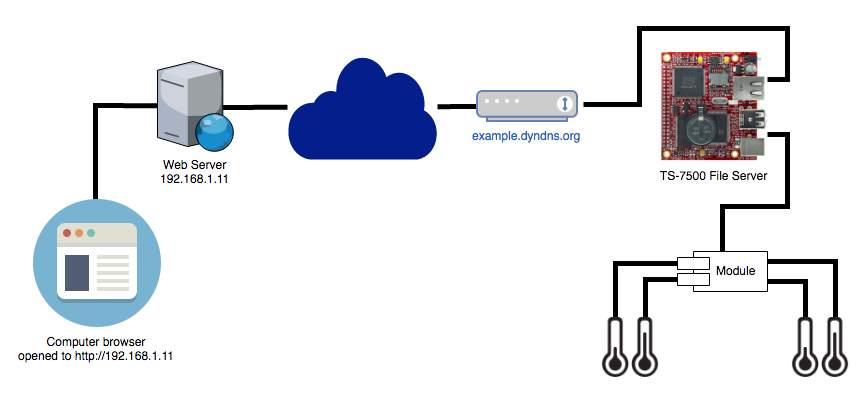
Four temperature sensors connected to a thermocouple module that is read using a single board computer acting as an SFTP file server. A web server in a different location is able to access the file server to store temperature data in it’s own database and present a nice looking dashboard to an end user. This project guide is going to briefly skim over the hardware setup, highlight a python script that reads temperature data over RS-232, and spend some time on setting up an HTML dashboard using Google Charts. Hopefully it’ll inspire your next project.
Setting up the Hardware
One of the first considerations was where the temperature sensors should be located in order to provide the most valuable data. In our case, which is in a remote cabin, we wanted to monitor both the inside and outside temperature as well as under the floor where the pipes are located and the coldest bathroom.
Once the temperature probes were installed in those key locations, wires were run into a closet where the RS-232 thermocouple module and TS-7500 is housed. The wiring here was pretty straightforward, especially when you consult the manuals, so there’s not a lot of value in going into detail here. We used some RJ45 wire and jacks to make things as clean as possible and hooked our thermocouple module to the TS-7500‘s RS-232 port using the DB9 to RJ45 adapter.
Another consideration you might want to keep in mind is power and Internet connection reliability. This project was setup in a remote area which is more or less off the grid and very prone to power and Internet outages. So, we hooked everything up to a battery backup. Not only that, but given the nature of Linux and power outages, we also setup the TS-7500 to boot from a read-only filesystem (after setting up our software). That’s why we’re using the USB thumbdrive to store our periodically collected temperature data to. We could technically just poll for temperatures when we want them, and then store them directly into our website database, but then we might miss collecting that historical data. A final consideration is to make sure to setup port forwarding on your router for SSH (port 22) and then use a service like dyndns.org to make it easy to access this server from the outside world.
Setting up the Software
Newer TS-7600 Product Available. The TS-7600 or TS-7700 are the new and improved versions of the TS-7500 series! Recommended for new designs.
The next step is to come up with a script to read the temperature data coming from the RS-232 port. Python lends itself very nicely to this sort of thing, so that was the chosen solution. The script opens the RS-232 port (using xuartctl), sends a read command (RD) to the thermocouple module, reads the result, converts it, and then saves it off to a CSV formatted file on the USB thumbdrive. Here’s what that script ended up looking like: Home
get-temps.py
#!/usr/bin/python
import os
import re
import sys
import csv
import time
import serial
import datetime
from subprocess import Popen, PIPE, STDOUT

def read_temp(probe_number):
    print("Sending command: $" + str(probe_number) + 'RD\\r\\n')
    ser.write("$" + str(probe_number) + 'RD\r\n')
    out = ''
    # let's wait one second before reading output (let's give device time to answer)
    print("Waiting for 1 seconds before reading")
    time.sleep(1)
    while ser.inWaiting() > 0:
        out += ser.read(1)
    if out != '':
        print("Received: " + out)
        return out
    else:
        print("ERROR: Did not receive")
        return ''

def getSerialPort():
  command = "/usr/local/sbin/xuartctl --port 0 --server --speed 300"
  p = Popen(command, shell=True, stdin=PIPE, stdout=PIPE, stderr=STDOUT, close_fds=True)
  output = p.stdout.read()
  regex = re.compile("ttyname=(.*)",re.DOTALL)
  r = regex.search(output)
  return r.groups()[0].strip()

print "Getting temperatures..."
print "Getting serial port to use..."
port = getSerialPort()
print "Going to use port: " + port
print "Setting up serial port..."
# configure the serial connections
ser = serial.Serial(
    port=port,
    baudrate=300,
    parity=serial.PARITY_NONE,
    stopbits=serial.STOPBITS_ONE,
    bytesize=serial.EIGHTBITS
)
already_open = ser.isOpen()
if not already_open:
    ser.open()

print "Getting datetime stamp..."
now = datetime.datetime.now()
date = now.strftime("%m/%d/%Y")
timestamp = now.strftime("%I:%M:%S %p")
print "Using datetime stamp of: " + timestamp

csv_row = []
csv_row.append(date)
csv_row.append(timestamp)
for i in range(1, 5):
    #Will get: *+00024.00
    data = read_temp(i)
    print "Read temp as: " + data
    if data[2] == "-":
        temp_c = data[2:]
    else:
        temp_c = data[3:]
    temp_f = str(float(temp_c) * 9.0 / 5.0 + 32)
    csv_row.append(temp_f)

print "Going to write the following to /mnt/usb/cabin_temps.csv: "
print csv_row

ofile_usb = open("/mnt/usb/cabin_temps.csv", 'a')
writer = csv.writer(ofile_usb, quoting=csv.QUOTE_NONNUMERIC)
writer.writerow(csv_row)
ofile_usb.close()

print "Done collecting temperatures"
Okay, great. With the script written and working, you can easily schedule it to run every hour as a cronjob. Before you configure the system to boot from a read-only filesystem (if you chose to), make sure you have SSH setup correctly and that you’re using a static IP address. This will be necessary for us to collect the data from our web dashboard server. Otherwise, that takes care of this server (we call it the temperature server). We can confidently leave and lock the closet door if needs be. The TS-7500 is rated to operate between 0 °C (32 °F) and 70 °C (158 °F), but has been tested to withstand temperatures down to -40 °C (-40 °F). This particular project has been installed and operating since 2011 and has successfully withstood the harsh Montana winters, with lowest recorded outside temperature reaching -40 °F (the highest temperature recorded is 95 °F, for those who are curious).
The next part of the project puzzle is getting a web server setup that will collect the data from the temperature server, store it, and display it in a nice dashboard.
Setting up the Dashboard
For this step, you’ll need to setup a web server. For our sake, with unreliable power and connections in a remote area (not to mention dial-up like Internet speeds), we chose to setup a server at a different, more reliable location. Technically, you could run a webserver right from the TS-7500 and have an all-in-one, low power, simpler solution. You’ll need to decide which path to take, but for this project, we used a separate server. As long as the server has the ability to write to a datastore/database and run a scheduled job, you can use anything you’d like, beit a physical dedicated box, a virtual machine, shared host, or cloud solution.
The general steps are to regularly (scheduled cronjob) download data from the temperature server using a script and SSH, store that data into a MySQL database, use a PHP script to read that data, parse and massage it into JSON format for Google Charts API to understand, and finally display it on the webpage.
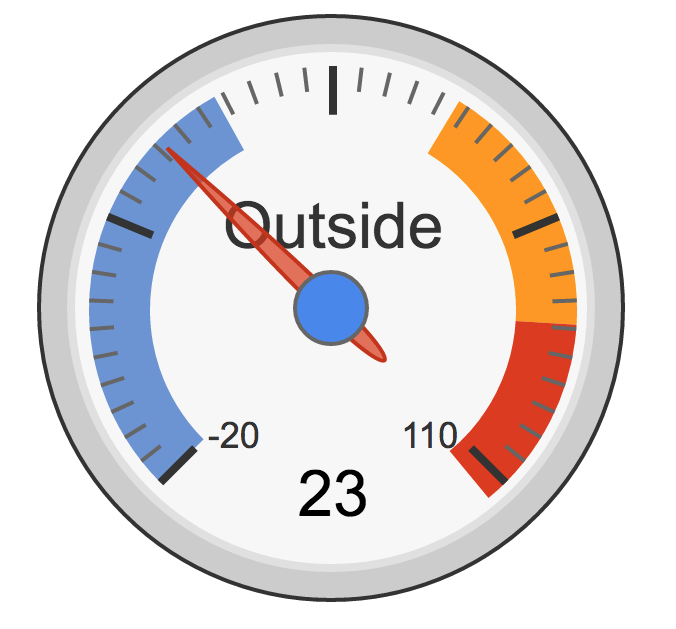
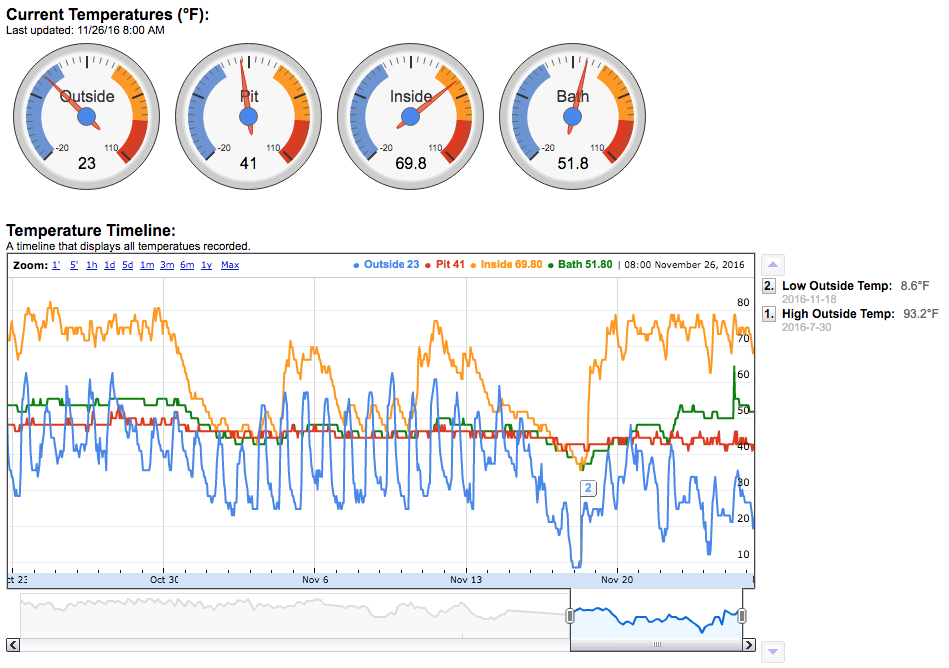
Admittedly, there is a lot to this step. As a reminder to keep the incentive going, the reason we’re doing all of this is to be able to better prepare for the quickly upcoming cold months given historical data. For us, it answers the question of “when do we need to start worrying about winterizing”? For you, it might be something different, in which case you can adjust as necessary. Here’s a look at the dashboard we’re striving for:
Database
Newer TS-7600 Product Available. The TS-7600 or TS-7700 are the new and improved versions of the TS-7500 series! Recommended for new designs.
The first thing we need is a database to store the data. MySQL was chosen since it was a familiar tool. The database cabinstats' and tablecabintemps’ was created to hold temperature data.
mysql> use cabinstats;
Reading table information for completion of table and column names
You can turn off this feature to get a quicker startup with -A

Database changed

mysql> show tables;
+----------------------+
| Tables_in_cabinstats |
+----------------------+
| cabintemps           |
+----------------------+
1 rows in set (0.00 sec)

mysql> desc cabintemps;
+-----------+--------------+------+-----+---------+----------------+
| Field     | Type         | Null | Key | Default | Extra          |
+-----------+--------------+------+-----+---------+----------------+
| id        | int(15)      | NO   | PRI | NULL    | auto_increment |
| timestamp | datetime     | YES  |     | NULL    |                |
| box       | decimal(4,1) | YES  |     | NULL    |                |
| lbath     | decimal(4,1) | YES  |     | NULL    |                |
| t_out     | decimal(4,1) | YES  |     | NULL    |                |
| t_in      | decimal(4,1) | YES  |     | NULL    |                |
+-----------+--------------+------+-----+---------+----------------+
6 rows in set (0.01 sec)
Scheduled Downloading Script
The next thing we need is a script to regularly fetch the temperatures from the temperature server. Again, Python made fairly quick work of this task. It’s setup to run every hour or so. Here’s what our script ended up looking like the following.
get-cabin-temps.py
#!/usr/bin/python

import urllib, urllib2, csv, os, time
from datetime import datetime
from time import gmtime, strftime
#import subprocess as sp
from subprocess import Popen, PIPE
import MySQLdb

class TempDB(object):
    ''' '''

    def __init__(self, _host, _un, _pw, _db, _table):
      '''Initially establish connection with DB.'''

      # Define the name of the table that will keep the stats
      self.table = _table

      try:
        self.conn = MySQLdb.connect(host = _host,
                                    user = _un,
                                    passwd = _pw,
                                    db = _db)
        self.cursor = self.conn.cursor(MySQLdb.cursors.DictCursor)
      except MySQLdb.Error, e:
        raise Exception("Error %d: %s" % (e.args[0], e.args[1]))

    def add_temp_to_db(self, ts, t1, t2, t3, t4):
      ''' '''

      print "Adding to DB (%s)" % ts
      cursor = self.cursor

      cursor.execute("""
          SELECT id FROM %s WHERE timestamp='%s' AND box='%s' AND t_out='%s'
        """ % (self.table, ts, t1, t3))
      if cursor.rowcount == 0:
        cursor.execute("""
            INSERT INTO %s (timestamp,box,lbath,t_out,t_in) VALUES ('%s','%s','%s','%s','%s')
          """ % (self.table, ts, t1, t2, t3, t4))
        return True
      else:
        return False


class TempCsv(object):
  ''' '''

  def __init__(self, host='', file='', dest=''):
    ''' '''

    self.host = host
    self.file = file
    self.dest = dest

  def parse_csv_file(self):
    ''' '''

    #[(1,2,3,4),(1,2,3,4)]
    temps = []
    temp_reader = csv.reader(open(self.dest, 'rU'))
    for row in temp_reader:
      colnum = 0
      for col in row:
        if colnum == 0:
          date = col
        elif colnum == 1:
          the_time = col
        elif colnum == 2:
          box = col
        elif colnum == 3:
          lbath = col
        elif colnum == 4:
          outside = col
        elif colnum == 5:
          inside = col
        colnum += 1

      #Convert to datetime for MySQL
      #0  : 12/21/2011
      #1  : 8:01:50 PM  OR 8:01 PM
      tmp = date + " " + the_time
      try:
        date_obj = time.strptime(tmp, '%m/%d/%Y %I:%M:%S %p')
      except ValueError:
        date_obj = time.strptime(tmp, '%m/%d/%Y %I:%M %p')

      ts = time.strftime('%Y-%m-%d %H:%M:%S', date_obj)

      print "Appended to temps %s: %s %s %s %s\n" % (ts,box,lbath,outside,inside)
      temps.append((ts,box,lbath,outside,inside))

    return temps

  def get_temps(self):
    ''' '''

    os.system('scp "%s:%s" "%s"' % (self.host, self.file, self.dest))
    print "Finished downloading the file.  Getting ready to parse it.\n"
    return self.parse_csv_file()


def main():
  ''' '''

  host = "root@example.dyndns.org"
  file = "/mnt/usb/cabin_temps.csv"
  dest = "~/cabin_temps_master.csv"

  db_host = 'localhost'
  db_name = 'cabinstats'
  db_un = 'root'
  db_pw = 'password'
  db_table = 'cabintemps'

  tempdb = TempDB(db_host, db_un, db_pw, db_name, db_table)
  tempcsv = TempCsv(host, file, dest)

  print "Downloading and importing csv file to DB..."
  temps_table = tempcsv.get_temps()

  print "Getting ready to insert all temps...\n"
  for ts, t1, t2, t3, t4 in temps_table:
      if tempdb.add_temp_to_db(ts, t1, t2, t3, t4):
        print "Adding to temps array: %s, %s, %s, %s, %s" % (ts, t1, t2, t3, t4)

if __name__ == '__main__':
   main()
Dashboard Code
Let’s take a look at the code behind the dashboard. It’s a pretty typical HTML/Javascript/PHP setup, where the javascript calls the PHP functions to get the massaged data for use with Google’s Chart API, and then draws the charts in the appropriate DIVs in HTML. There is a ton of room for improvement here, but it works. Here are the main code snippets responsible for displaying the data, broken into HTML, Javascript, and PHP sections. Home
HTML
<html>
<head>
<title>The Cabin Temperature Dashboard</title>
</head>
<body>
<h1>Current Temperatures (°F):</h1>
<h2>Last updated: <?=get_currenttempsdate($db);?></h2>
<div id='currenttemps'></div>
<h1>Temperature Timeline:</h1>
<h2>A timeline that displays all temperatures recorded.</h2>
<div id="timelinetemps" style='width: 1000px; height: 400px;'></div>
</body>
</html>
This is all there is to this page. Just a few elements, with the <div> elements being the most important. These each have their own id that the javascript uses to know which div content to update.
Javascript
Diving into the next layer of our website code, we see the javascript responsible for loading the Google Charts API and using it. There are a couple of inline PHP calls that will insert the JSON data directly into the script, making things fairly clean.
<script type='text/javascript' src='https://www.google.com/jsapi'></script>
<script type='text/javascript'>
  google.load('visualization', '1', {packages: ['corechart', 'table', 'gauge', 'annotatedtimeline']});

  google.setOnLoadCallback(draw_currenttemps);
  google.setOnLoadCallback(draw_timelinetemps);

  function draw_currenttemps() {
     var data = new google.visualization.DataTable();
     data.addColumn('string', 'Label');
     data.addColumn('number', 'Value');
     <?=get_currenttemps($db);?>

     var opts = {
        width: 650, height: 300,
        greenColor: '#6A93D4',
        greenFrom: -20, greenTo: 31,
        redFrom: 90, redTo: 120,
        yellowFrom:60, yellowTo: 90,
        minorTicks: 10, min: -20, max: 110
     };

     var table = new google.visualization.Gauge(document.getElementById('currenttemps'));
     table.draw(data, opts);
  }

  function draw_timelinetemps() {
     var data = new google.visualization.DataTable();

     data.addColumn('datetime', 'Date');
     data.addColumn('number', 'Outside');
     data.addColumn('string', 'title1');
     data.addColumn('string', 'text1');
     data.addColumn('number', 'Pit');
     data.addColumn('number', 'Inside');
     data.addColumn('number', 'Bath');
     <?=get_timelinetemps($db);?>

     var opts = {
         displayRangeSelector: true,
         displayZoomButtons: true,
         thickness: 2,
         scaleType: 'maximized',
         displayAnnotations: true,
     };

     var table = new google.visualization.AnnotatedTimeLine(document.getElementById('timelinetemps'));
     table.draw(data, opts);
  }
</script>
PHP
Lastly, here’s the PHP code that reads from the database and massages the data into something Google Charts can understand. Notice I’m not providing all the code for a few reasons: 1.) the code was written back before I knew better than to use the deprecated mysql_query() PHP calls instead of PDO, 2.) it’d be overwhelming, 3.) it’s mostly just helper functions anyways. Just pay attention that I’m passing in a $db object that was instantiated earlier in the PHP script using $db = new DB();. Other than that, there’s not much else to this code.
function get_currenttemps($db) {
   $query_ct = "SELECT timestamp, box, lbath, t_out, t_in FROM cabintemps order by timestamp desc limit 1;";
   $db->run_query($query_ct);
   $temp_time = "";
   $temps_value = "";
   while ($line = mysql_fetch_array($db->get_result(), MYSQL_ASSOC)) {
       $temp_datetime = strtotime($line['timestamp']);
       $temp_time = date("m/d/y g:i A", $temp_datetime);
       $temps_value = "data.addRows([['Outside', %s], ['Pit', %s], ['Inside', %s], ['Bath', %s]]);";
       $temps = sprintf($temps_value, $line['t_out'], $line['t_in'], $line['box'], $line['lbath']);
   }

   return $temps;
}

function get_timelinetemps($db) {
   $interval = "6 MONTH";
   $query_ct = "SELECT timestamp, box, lbath, t_out, t_in FROM cabintemps WHERE timestamp > DATE_SUB(CURDATE(), INTERVAL $interval) order by timestamp;";
   $db->run_query($query_ct);
   $all_temps_array = array();
   $all_temps_value = "";
   while ($line = mysql_fetch_array($db->get_result(), MYSQL_ASSOC)) {
       $temp_datetime = strtotime($line['timestamp']);
       $temp_all_time = date("Y, m-1, d, H, i", $temp_datetime);

       # $all_temps_value = "[new Date ( year, month-1, day, hour, minute ), outside, inside, server, bath],";
       $all_temps_value = "[new Date ( $temp_all_time ), " . $line['t_out'] . ", undefined, undefined, " . $line['t_in'] . ", " . $line['box'] . ", " . $line['lbath'] .
"],";
       array_push($all_temps_array, $all_temps_value);
   }

   #find min and max
   $query_max = "SELECT * from cabintemps WHERE t_out = (SELECT MAX(t_out) FROM cabintemps WHERE timestamp > DATE_SUB(CURDATE(), INTERVAL $interval)) order by timestamp
desc limit 1";
   $db->run_query($query_max);
   while ($line = mysql_fetch_array($db->get_result(), MYSQL_ASSOC)) {
       $temp_datetime = strtotime($line['timestamp']);
       $temp_all_time = date("Y, m-1, d, H, i", $temp_datetime);

       #$all_temps_value = "[new Date ( $temp_all_time ), " . $line['t_out'] . ", " . $line['t_in'] . ", " . $line['box'] . ", " . $line['lbath'] . ", 'High Outside Temp
: ', '" . $line['t_out'] . "\u00B0F'],";
       $all_temps_value = "[new Date ( $temp_all_time ), undefined, 'High Outside Temp: ', '" . $line['t_out'] . "\u00B0F', undefined, undefined, undefined],";
       array_push($all_temps_array, $all_temps_value);
   }

   $query_min = "SELECT * from cabintemps WHERE t_out = (SELECT MIN(t_out) FROM cabintemps WHERE timestamp > DATE_SUB(CURDATE(), INTERVAL $interval)) order by timestamp
desc limit 1";
   $db->run_query($query_min);
   while ($line = mysql_fetch_array($db->get_result(), MYSQL_ASSOC)) {
       $temp_datetime = strtotime($line['timestamp']);
       $temp_all_time = date("Y, m-1, d, H, i", $temp_datetime);

       #$all_temps_value = "[new Date ( $temp_all_time ), " . $line['t_out'] . ", " . $line['t_in'] . ", " . $line['box'] . ", " . $line['lbath'] . ", 'Low Outside Temp:
 ', '" . $line['t_out'] . "\u00B0F'],";
       $all_temps_value = "[new Date ( $temp_all_time ), undefined, 'Low Outside Temp: ', '" . $line['t_out'] . "\u00B0F', undefined, undefined, undefined],";
       array_push($all_temps_array, $all_temps_value);
   }

   $start_string = "data.addRows([\n";
   $data_row_string_all_temps = implode("\n", $all_temps_array);
   $end_string = "\n]);";

   $all_temps_data = $start_string . $data_row_string_all_temps . $end_string;

   return $all_temps_data;
}
Hopefully, this helped you to have a basic understanding of the different code parts that make up the web dashboard. Again, we have a script to download the raw data and store it into a database and we have a webpage that will read from the database and display it in a human-friendly way. This was the final piece in completing our project.
Conclusion
Newer TS-7600 Product Available. The TS-7600 or TS-7700 are the new and improved versions of the TS-7500 series! Recommended for new designs.
This project was an interesting and rewarding learning experience. We were able to come up with a robust solution that makes planning and monitoring a home easy and meaningful. The ability to view current conditions of your home (or cabin, in this case) from anywhere in the world is incredibly convenient and helpful for planning so your pipes don’t burst. It’s also handy in situations where high temperatures are a concern, like pets or livestock in kennels or barns. Naturally, there’s more than one way to do this, some easier than others. For example, if I were to do it again, I’d use more AJAX calls for real-time temperature polling instead of scheduled. I’d encourage you to come up with your own solution that meets your requirements and suits your particular situation using what you’ve learned from this project and then build upon it. This has potential in both personal and industrial business applications, such as home automation, so feel inspired and start building!
If you have any questions or comments about the project, or if you have ideas to improve it, please be sure to use the comment form below. Home